September 23, 2026
Test observability is the capacity to understand test execution behavior from its outputs: not just whether a test passed or failed, but why it flaked, how long it took relative to its baseline, which code paths it exercised, and what changed in the environment when failures clustered. Standard test reporting—pass counts, failure rates, summary dashboards—addresses the first question and ignores the rest. A test observability stack addresses all of them by instrumenting test execution at a trace level, collecting execution metadata alongside results, and surfacing signals that identify flakiness, coverage gaps, and systemic degradation before they become CI stability problems. In 2026, with AI-generated code increasing the volume of code changes per sprint and team velocity outpacing manual review capacity, test observability has moved from a nice-to-have instrumentation exercise to a foundational capability for teams that want their test suite to remain trustworthy as it grows.
This guide covers what test observability means in practice, how to instrument test execution for trace-level visibility, how to detect and surface flakiness signals, and how to identify coverage gaps through execution data rather than through coverage metrics alone. For context on where test observability fits in a broader QA strategy, see Astaqc's complete software testing guide and test automation services. Teams building or scaling test infrastructure can engage Astaqc's software testing services for observability stack design and implementation.
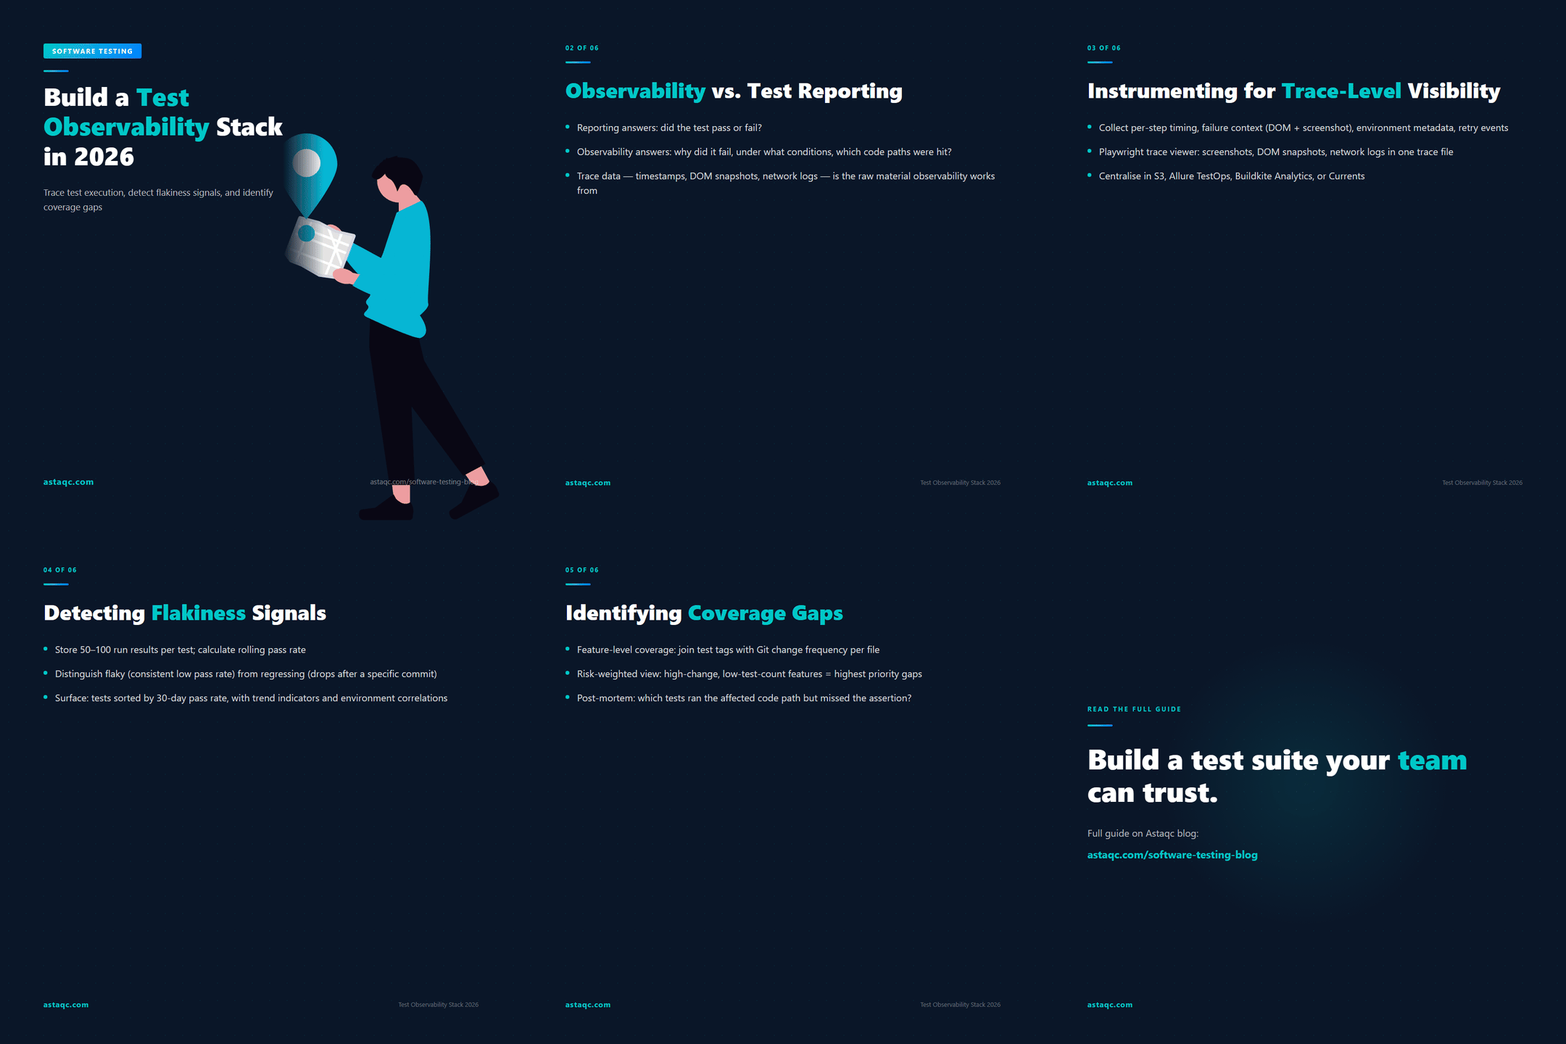
Test reporting is the output layer: the dashboard that shows which tests passed, which failed, and what the overall coverage percentage is. It answers "what happened in this test run?" Test observability is the instrumentation layer: the collection of execution metadata—timestamps, selector resolution times, DOM state at failure, network request logs, environment variable values, CPU and memory usage of the test runner—that answers "why did this test fail, and what conditions produced that failure?" Test reporting works from the test result file; test observability works from trace data collected during execution.
The distinction matters because most test failures that cause CI instability are not immediately reproducible from the test result alone. A flaky test that fails 15% of the time in CI but never fails locally does not fail because the test logic is wrong—it fails because of a timing assumption, a shared resource state, or an environment variable that differs between local and CI execution. A test result that records "assertion failed: expected Loading not to appear" does not tell you whether the failure was caused by a slow API response, a CI runner with insufficient CPU, or a race condition in the application's state management. Trace data from the execution tells you: what was the elapsed time between the action that triggered the loading state and the assertion? What was the response time of the API call during this run? Was this CI runner processing other jobs in parallel?
Building test observability requires treating test execution as a distributed system with observable state transitions, not as a binary pass/fail process. Each test is a sequence of actions that produce state changes in the application; each state change has a timing dimension, a dependency on external services, and a relationship to the test's environment. Instrumenting that sequence produces data that can be queried and analyzed, not just reported. This is the same observability model that production engineers apply to application monitoring: traces, spans, and structured events rather than boolean health checks. For teams scaling this capability, Astaqc's AI in software testing guide covers how AI-assisted tooling surfaces observability insights that manual analysis would miss at scale.
The foundation of a test observability stack is execution instrumentation. Most test frameworks produce a result file (JUnit XML, JSON, TAP) at the end of a run; observability requires collecting structured data during execution. The minimum instrumentation for a useful observability stack includes: per-step timing (not just per-test duration—individual action durations within the test), failure context capture (DOM snapshot, screenshot, network log at the time of failure), environment metadata (runner ID, OS version, browser version, CI job ID, Git SHA being tested), and test identity data (test name, suite, file path, tags).
| Signal Type | What to Collect | Primary Use |
|---|---|---|
| Per-step timing | Start/end timestamp for each action within a test | Identifying slow steps that introduce timing flakiness |
| Failure context | DOM snapshot, screenshot, console log at failure point | Diagnosing without re-running; reducing MTTR on CI failures |
| Network trace | Request/response pairs for each network call during execution | Identifying external API timing as a flakiness source |
| Environment metadata | Runner ID, browser version, OS, CI job ID, Git SHA | Correlating failures with specific runners or software versions |
| Retry events | Each retry attempt with outcome and elapsed time | Measuring retry masking rate vs. genuine flakiness rate |
For Playwright-based suites, the built-in trace viewer collects most of this data automatically when tracing is enabled: screenshots at each step, DOM snapshots, network request logs, and timing data are packaged into a trace file that can be viewed locally or uploaded to a centralized store. The Playwright trace API can be configured to capture on first retry only, on all failures, or on all test runs, with a corresponding trade-off between storage volume and diagnostic coverage. For Selenium-based suites, equivalent trace data must be assembled from multiple sources: screenshots via WebDriver, network logs via browser CDP integration, and timing from the test framework's before/after hooks.
Centralizing trace data requires a collection pipeline: a storage backend (S3, GCS, or a purpose-built observability platform like Buildkite Test Analytics, Allure TestOps, or Currents) that receives trace data from each CI run, indexes it by test identity and run metadata, and provides a query interface. Teams that use testing documentation services through Astaqc typically include observability stack architecture as part of the infrastructure documentation deliverable, establishing the data flow from CI to storage to query interface before the suite grows to a volume where ad-hoc diagnosis becomes impractical. See also Astaqc's manual testing services for context on when manual test investigation is more appropriate than automated trace analysis for a given class of failure.
Flakiness detection requires a historical baseline. A single test failure is a data point; a pattern of test failures at a consistent rate across specific conditions (specific runners, specific time windows, specific code paths) is a flakiness signal. Building that baseline requires storing test results by test identity over time—not just the most recent run, but a rolling window of 50–100 runs per test, keyed by the test's canonical identifier (file path plus test name) so that results accumulate across code changes and can be queried to calculate a pass rate per test.
A test that passes 85% of the time across 100 runs is flaky; a test that passes 100% of the time until a specific commit and then fails 30% of the time has a regression. Both are detectable from stored results data, but they require different interventions. The flaky test may have a timing dependency that needs to be made deterministic or a resource dependency that needs to be isolated. The regressing test has a code change correlation that can be identified by joining the failure pattern with the Git commit history. Neither intervention is possible without the stored time-series data; a dashboard that only shows the current run's pass/fail state cannot distinguish between these two patterns.
Surfacing flakiness signals means making them visible before they affect team confidence in the test suite. The minimum viable flakiness surface is a list of tests sorted by pass rate over the last 30 days, filterable by suite and tag, with a count of runs and a trend indicator (improving, stable, degrading). More advanced surfaces correlate flakiness rate with environment variables (this test flakes 40% on runner-type-A but 0% on runner-type-B) or with application state (this test flakes when run after the payment test suite but not in isolation). These correlations identify the root cause class—infrastructure, test isolation, application state—and direct the fix to the right layer. For QA teams scaling beyond what a single engineer can manage, Astaqc's QA team services include flakiness triage and remediation as part of ongoing suite health management.
Traditional coverage metrics—line coverage, branch coverage, statement coverage—measure whether test execution touched a line of code, not whether it validated the behavior that line implements. A line of code executed inside an assertion that always passes contributes to coverage without providing meaningful validation. Execution data from a properly instrumented test observability stack provides a richer signal: which features are exercised by which tests, how often those tests run, and whether the tests that exercise critical paths are the ones most likely to catch regressions.
Feature-level coverage mapping connects tests to the application features they exercise by tagging tests with feature labels and correlating test run frequency with feature change frequency. A feature that changes in every sprint and has only one test covering it is a coverage gap by this measure even if that test provides 100% code coverage of the changed lines. A feature that has 20 tests but has not changed in six months has lower coverage risk than the frequently-changed feature with one test. This risk-weighted coverage view is produced by joining test tags with Git change frequency for the files those tests exercise—a data join that requires both the test observability stack and access to the repository's change history. For context on how coverage decisions map to team structure, see Astaqc's guide to outsourcing QA.
Code path correlation is the complement to feature coverage: given that a defect was found at a specific location in the application, which tests exercised that code path, and why did they not catch the defect? This post-mortem analysis requires the same trace data used for flakiness detection—per-test execution traces that include which code paths were hit during the test run. When a bug escapes to production, querying the observability stack for tests that executed the affected code path in the previous release cycle and examining their assertion coverage tells you whether the gap was in test selection (no test executed that path) or in assertion quality (tests executed the path but did not assert on the affected behavior). For teams building test observability infrastructure with guidance, Astaqc's test automation services include coverage gap analysis as part of suite audit engagements, and performance testing services address the parallel need to instrument performance paths alongside functional coverage.
Test monitoring watches for test suite health metrics in aggregate—pass rate trends, run duration trends, flakiness rate—and generates alerts when metrics fall outside acceptable bounds. Test observability provides the data infrastructure that makes monitoring meaningful: trace-level execution data that explains why a metric moved. Monitoring without observability produces alerts that tell you something went wrong; observability gives you the data to find out what. In practice, test monitoring is typically implemented first as a dashboard over stored test results, and test observability is built out as the instrumentation that makes the dashboard's signals actionable rather than advisory.
Playwright has the most complete built-in tracing capability: the trace viewer captures screenshots, DOM snapshots, network request logs, and per-action timing in a single trace file per test run. Cypress supports video recording and screenshot capture with its built-in test runner, and integrates with Cypress Cloud for historical result storage and flakiness detection. WebdriverIO supports trace collection through its reporter plugins, with Allure being a common output format. Selenium has no built-in tracing, requiring teams to assemble trace data from WebDriver screenshot APIs, CDP network logging, and custom before/after hook instrumentation. For no-code platforms, TestInspector provides live WebSocket run streaming and structured step-level run logs without requiring additional instrumentation.
A 50-run window is sufficient to detect tests with a flakiness rate above 10% with reasonable statistical confidence; a 100-run window is required to detect flakiness rates in the 5–10% range with confidence. For test suites that run multiple times per day, a 50-run window represents less than a week of history; for suites that run once per day, it represents 7–10 weeks. The window should be time-bounded as well as count-bounded: a 50-run window that spans six months includes code changes that may have altered the test's behavior, making early results in the window unreliable as a baseline for the current version of the test.
This analysis requires code coverage data collected during test execution—Istanbul for JavaScript, Coverage.py for Python, JaCoCo for Java—combined with the stack trace or file location of the production bug. With both, you can query: which tests had coverage hits on the affected file and function, and of those tests, which assertions validated the affected behavior? A test that executed the affected code path but only asserted on an unrelated output did not cover the bug; a test that asserted on the exact output that the bug altered would have caught it if it had been run against the buggy version. This analysis identifies whether to add a new test or strengthen an existing test's assertions, which is the most precise way to respond to production escapes without over-indexing on coverage metrics.
Prioritize coverage gaps by combining two signals: feature change frequency (how often the feature changes in the Git history, indicating development activity and regression risk) and business impact (what happens to users or revenue when the feature fails, regardless of change frequency). A payment processing feature that changes infrequently but has zero automated coverage is higher priority than a settings page that changes frequently but whose failures are immediately visible and low-impact. Join the feature's change frequency from Git blame data with its business impact rating from a manual stakeholder mapping exercise, and sort the resulting list. For teams without the capacity to perform this analysis in-house, Astaqc's software testing services include coverage gap analysis as a deliverable, using Git history, test execution traces, and stakeholder input to produce a prioritized coverage backlog.
Test reporting tells you what happened. Test observability tells you why. The gap between them is where flaky tests compound into CI paralysis and where coverage gaps hide until a defect in production reveals them. Closing that gap requires instrumenting test execution as a first-class data source rather than treating test results as a terminal output.
September 23, 2026


Sign up to receive and connect to our newsletter

We founded ASTAQC as a tight-knit group of professional Software Testers and software developers.
Subscribe to our Newsletter