October 8, 2026

Test Automation Strategy Audit in 2026: How to Find What Your Test Suite Is Actually Optimizing For
A test automation strategy audit answers one question that pass rate alone cannot answer: what failure classes is your test suite actually equipped to catch? Most suites that have grown organically over two or more years are optimized for test count, CI green rate, and feedback speed on syntax errors and simple integration failures. The application defects that cause production incidents — business logic failures, authorization boundary violations, data integrity errors under concurrent load, and API contract breakdowns — are present in the feature surface but absent from the assertion layer. An audit surfaces this misalignment by examining four signals: assertion quality per test, defect escape rate per coverage area, stale test percentage, and coverage-to-risk alignment across the application's feature surface. Astaqc's test automation services include strategy audits as a standard deliverable for teams that want to understand what their existing investment actually protects. The manual versus automated testing guide covers the foundational distinction between running tests and validating behavior, which is the core insight that a strategy audit applies at scale.
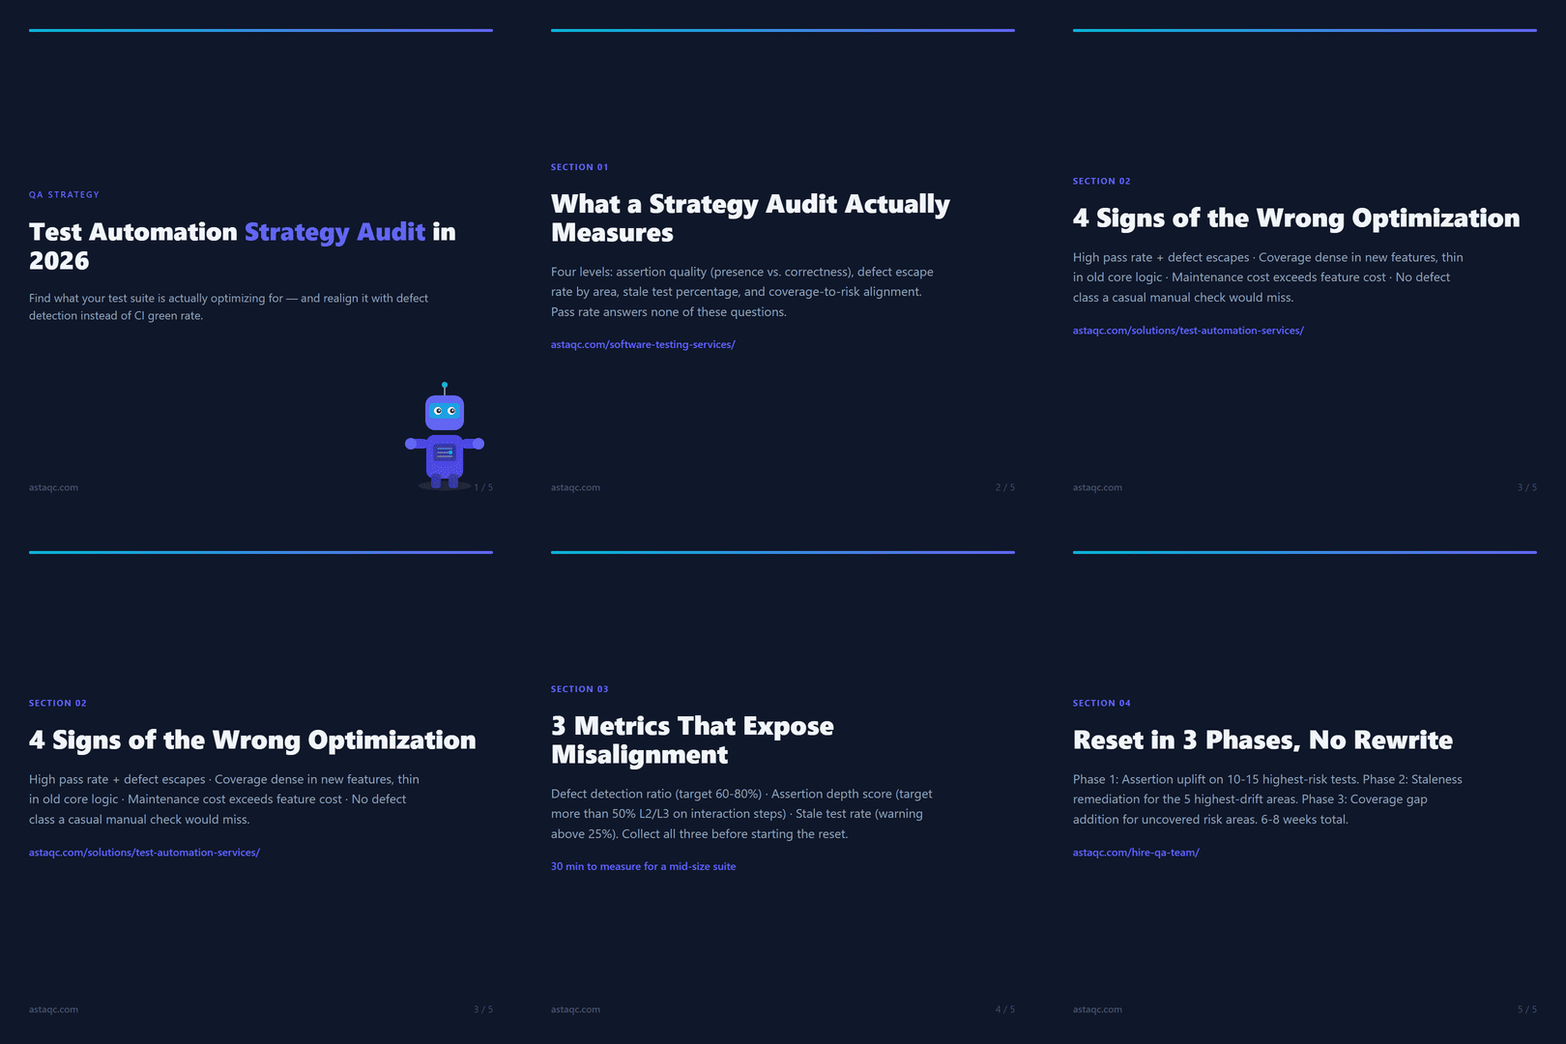
A strategy audit is not a code review and not a test count inventory. It is a structured examination of what the test suite would and would not catch if a realistic defect occurred in each area of the application. The audit operates at four levels. The first is assertion coverage: for each test, does the assertion layer validate correctness — a specific value, a specific state, a specific behavior — or only presence (element exists, request returned 200, page loaded without an error)? Presence assertions fail on crashes and 500 errors. Correctness assertions fail on the broader set of defects that matter to users. The ratio of correctness assertions to presence assertions is the simplest proxy for assertion quality.
The second level is defect escape rate by area: which application areas have generated production incidents or bug reports in the past three to six months, and what was the test coverage in those areas at the time of the incident? If a payment processing bug escaped to production in an area where 12 tests were passing in CI, those 12 tests were not catching the relevant defect class — either they were asserting on the wrong things or they were not testing the paths where the defect lived. This is the most direct evidence of strategy misalignment: tests that run and pass in the exact area where a defect escaped.
The third level is stale test percentage: what fraction of the test suite has not been modified in a sprint or more, while the features those tests cover have been actively developed? A test written for a feature three sprints ago and not updated since is likely asserting on behavior that no longer exists in exactly the form the test expects. These tests fall into one of two failure modes: they continue to pass because the assertions are too weak to notice behavioral changes, or they are disabled because they fail on the new behavior and no one has time to update them. The fourth level is risk alignment: do the highest-risk areas of the application — the flows handling money, user data, authentication, and core business logic — have more test coverage per line of change than lower-risk areas? In most organic suites, coverage is distributed by which engineer added tests most recently rather than by which features deserve the most scrutiny. Astaqc's software testing services include structured coverage audits that map existing test assets against feature risk classifications, and the complete software testing guide covers risk-based testing as a methodology for prioritizing coverage investment.
The first sign is a high pass rate with a sustained defect escape rate. If more than 95% of tests pass in CI but production incidents occur monthly or quarterly from areas with active test coverage, the suite is optimizing for CI stability rather than defect detection. Tests have been tuned — consciously or not — to pass reliably. Assertions were simplified to remove flakiness, test scope was narrowed to avoid dependencies that introduced failures, and tests that caught real bugs were disabled because they blocked delivery. The result is a suite that passes reliably precisely because it is no longer asserting on the things that would fail when something breaks.
The second sign is that new tests are added to areas that already have coverage rather than areas that have none. When a developer adds tests, they add them near the code they just wrote. This compounds existing coverage concentration rather than filling gaps. The features a team wrote early in the product's life — often the core business logic — have fewer tests than features written later, when writing tests was a team expectation. A coverage map that shows density in recently-built features and thin coverage in the oldest, most-changed core logic is a sign that the suite optimizes for coverage-follows-commits rather than coverage-follows-risk.
The third sign is that the test suite takes longer to maintain than it takes to write new features. When more than 25–30% of CI failures are test failures caused by test brittleness rather than real application regressions, the suite has accumulated more test maintenance debt than test coverage value. Engineers start routing around the test suite — skipping the test run locally, force-merging after CI fails, or disabling tests to unblock a release. The fourth sign is that no one on the team can name three defect classes the test suite would catch that a human tester looking at the screen for five minutes would not catch. This is the ultimate strategy misalignment signal: a suite that can only catch defects visible to a casual human observer is duplicating manual testing rather than automating the defect classes that manual testing reliably misses — race conditions, API contract violations, state corruption under concurrent requests, and data boundary failures. Astaqc's outsource software testing guide covers how external QA teams calibrate test suite strategy against the specific defect risk profile of an application.
| Sign | What It Indicates | Measurement |
|---|---|---|
| High pass rate + defect escapes | Suite optimizes for CI stability, not detection | % defects escaped from areas with active coverage |
| Coverage concentrated in new features | Coverage follows commits, not risk | Test density by feature age vs. feature risk classification |
| Test maintenance cost exceeds new feature cost | Suite optimizes for its own internal consistency | % CI failures from test brittleness vs. real regressions |
| No defect classes beyond visual check | Suite duplicates manual testing, not complements it | Assertion types: presence/status vs. value/state/behavior |
Three metrics collected from CI history and defect logs reveal strategy misalignment with enough precision to act on. The first is the defect detection ratio: of the bugs reported or escalated in the past three months, what percentage were caught by the automated test suite before reaching QA or production? A healthy ratio is 60–80% for teams with mature automation. Below 40%, the suite is catching fewer than half the defects it should. Calculate this by reviewing each recent incident or bug ticket and checking whether any CI test was failing before the bug was reported. If the tests passed and the bug still shipped, that is a detection failure.
The second metric is assertion depth score: for a random sample of 20 tests, count the assertion layers per test step on interaction steps (form submissions, API calls, navigation to content pages). Classify each assertion as L1 (presence/status), L2 (content/value), or L3 (state/behavior). A suite with strong assertion depth has at least 50% of interaction steps with L2 or L3 assertions. A suite with weak assertion depth has 80% or more of interaction steps at L1 only. This metric takes about 30 minutes to calculate for a mid-size suite and directly identifies where to invest assertion improvement effort.
The third metric is stale test rate: the percentage of tests that have not been modified in more than 30 days while the features they cover have been changed. A stale test rate above 25% is a warning sign; above 40% the suite has accumulated significant staleness debt. Astaqc's AI in software testing guide covers AI-assisted staleness detection tools that cross-reference test coverage against code change frequency automatically. Astaqc's software testing services help teams establish these baselines and implement tracking systems that make strategy misalignment visible before it results in production incidents.
| Metric | How to Measure | Healthy Range | Warning Threshold |
|---|---|---|---|
| Defect detection ratio | Bugs caught by CI / total bugs reported | 60–80% | <40% |
| Assertion depth score | % of interaction steps with L2+ assertions | >50% L2/L3 | >80% L1 only |
| Stale test rate | % tests not updated while feature changed | <15% | >25% |
| Test brittleness rate | % CI failures from test instability vs. real regression | <10% | >25% |
Resetting the optimization target does not require deleting existing tests and starting over. The existing tests have accumulated value in the form of execution infrastructure, environment configuration, and maintenance patterns — the cost of those investments is a reason to improve what exists rather than discard it. The reset happens in three phases over six to eight weeks, addressing each of the three primary misalignment types: assertion weakness, staleness accumulation, and risk-coverage misalignment.
Phase one is assertion uplift on the highest-risk paths. Select the 10–15 tests that cover the highest-risk application flows and upgrade each test's assertions from L1 to L2 and L3. For a test that currently asserts only that a form submission returns 200, add assertions on the response body fields that the form submission should create, the UI confirmation message text, and the absence of error state on the page. This takes 30–60 minutes per test for an engineer familiar with the feature. After the upgrade, run the improved tests against the current build. Any test that fails after the upgrade is revealing a real gap — either the application is not behaving as the assertions specify, or the assertions were incorrect and need calibration. Both outcomes are useful information.
Phase two is staleness remediation for the highest-drift areas. Use the stale test rate metric to identify the five application areas with the most tests that have not been updated despite feature changes. For each area, run the existing tests against the current build and review the results. Tests that now fail need assertion updates. Tests that still pass need a manual review to determine whether the assertions are still meaningful — a passing test with stale assertions often means the application changed and the assertions are no longer testing the current behavior, only asserting on something that happens to still be true.
Phase three is coverage gap addition for the uncovered risk areas identified in the audit. With existing tests improved and staleness addressed, the audit's third deliverable is a prioritized list of test additions: one to three tests per high-risk area that has no current coverage or coverage that the prior two phases revealed as insufficient. Astaqc's testing documentation services include test strategy documentation that captures the post-audit optimization target. The software testing cost guide covers ROI modeling for test automation investment relative to defect detection outcomes. Astaqc's hire QA team services provide dedicated engineers who perform assertion uplift and staleness remediation as part of their first engagement sprint.
A focused audit of a mid-size test suite (100–500 tests) takes two to three days for an experienced QA engineer who knows the application. The majority of that time is the defect escape rate analysis — cross-referencing recent production incidents against CI test state requires manual investigation of each incident. Collecting the assertion depth score and stale test rate metrics is faster and can be partially automated. The output is a prioritized list of improvements with estimated effort for each. Astaqc's hire QA team services provide engineers who perform this audit as part of initial engagement scope and deliver actionable findings within the first two-week sprint.
Fix existing tests on high-risk paths first, then add new tests for uncovered areas. An existing test with weak assertions, improved to strong assertions, provides more immediate value than a new test on a low-risk path — it upgrades coverage the team already assumed existed. New tests on uncovered high-risk areas come second. New tests on low-risk areas should only be added after the higher-priority work is complete. This sequencing ensures investment improves actual defect detection rather than increasing test count without improving coverage quality.
Code coverage tools (Istanbul for JavaScript, SimpleCov for Ruby, Coverage.py for Python) measure which lines execute during a test run, providing a starting point for identifying completely uncovered code. Git log analysis scripts can generate the stale test rate metric by comparing file modification dates between test files and the application files they cover. Defect escape rate requires manual investigation — no tool automates the cross-reference between a production incident and the state of the test suite at the time of the incident. Astaqc's AI in software testing guide covers AI-assisted coverage analysis tools that can partially automate assertion quality classification.
Three process changes prevent re-accumulation: add assertion depth as a pull request review criterion for test additions (new tests must include L2+ assertions on interaction steps), schedule a quarterly staleness review using the stale test rate metric, and track defect detection ratio as a team metric reported in sprint reviews alongside pass rate. Pass rate alone is insufficient as a team health metric — it measures CI stability, not coverage quality. Adding defect detection ratio to the same dashboard creates accountability for keeping it above the threshold the audit established. Astaqc's test automation services include process design for sustainable coverage quality maintenance as part of ongoing QA engagement scope.
Yes, and it is the recommended first step before any migration. A migration is an opportunity to carry forward only the tests that provide genuine coverage value — tests with strong assertions on high-risk paths — and leave behind accumulated staleness and brittle presence-only tests. Migrating a full organic test suite without an audit typically migrates all the coverage debt along with all the coverage value, producing a larger suite with the same strategy misalignment at a higher maintenance cost. The complete software testing guide covers framework migration strategy and the role of coverage audits in migration planning.
Most test suites that report 95% CI pass rates have been optimized for CI stability, not defect detection. The pass rate looks good. The defect escape rate tells a different story. A strategy audit reads the second number, not the first.
October 8, 2026


Sign up to receive and connect to our newsletter

We founded ASTAQC as a tight-knit group of professional Software Testers and software developers.
Subscribe to our Newsletter