September 9, 2026
Test observability is the practice of instrumenting test suites to produce structured data about why tests fail, not just whether they fail. A test suite that provides observability surfaces failure categories—flaky, genuine defect, environment issue, test data expiry—alongside step-level timing to identify where in a test run latency accumulates, historical trend data to distinguish a new regression from a recurring unstable test, and root cause tagging that lets engineers classify failures consistently over time. In 2026, most teams have pass/fail reporting from their CI platform: a green or red status per test with a log file attached, and nothing more structured than that. The consequence is ad hoc triage: each engineer who investigates a failure reads the log, identifies what went wrong, and decides whether to fix the test or file a bug based on individual judgment, with no structured record shared or persisted about the pattern of failures across the suite. Test observability converts that unstructured triage work into data that reduces the time to classify each failure, surfaces patterns that individual investigation misses, and makes the quality of the test suite visible to the engineering team rather than invisible background maintenance work.
The practical result of moving to an observable test suite is a reduction in the engineering time required to maintain test coverage at a given scale. Teams without test observability report spending fifteen to thirty minutes per failing test on triage and classification when a new failure appears in a CI run. Teams with structured observability data—failure categories applied consistently, step-level failure location identified automatically, historical trend data available for comparison—report triage times of two to five minutes for familiar failure patterns. At a scale of twenty failing tests per sprint, the difference between fifteen-minute and three-minute average triage is roughly four hours of engineering time per week. Astaqc's test automation services include observability instrumentation as part of test suite maturity assessments, and the AI in software testing guide covers how AI tooling is being applied to automated failure classification in 2026.
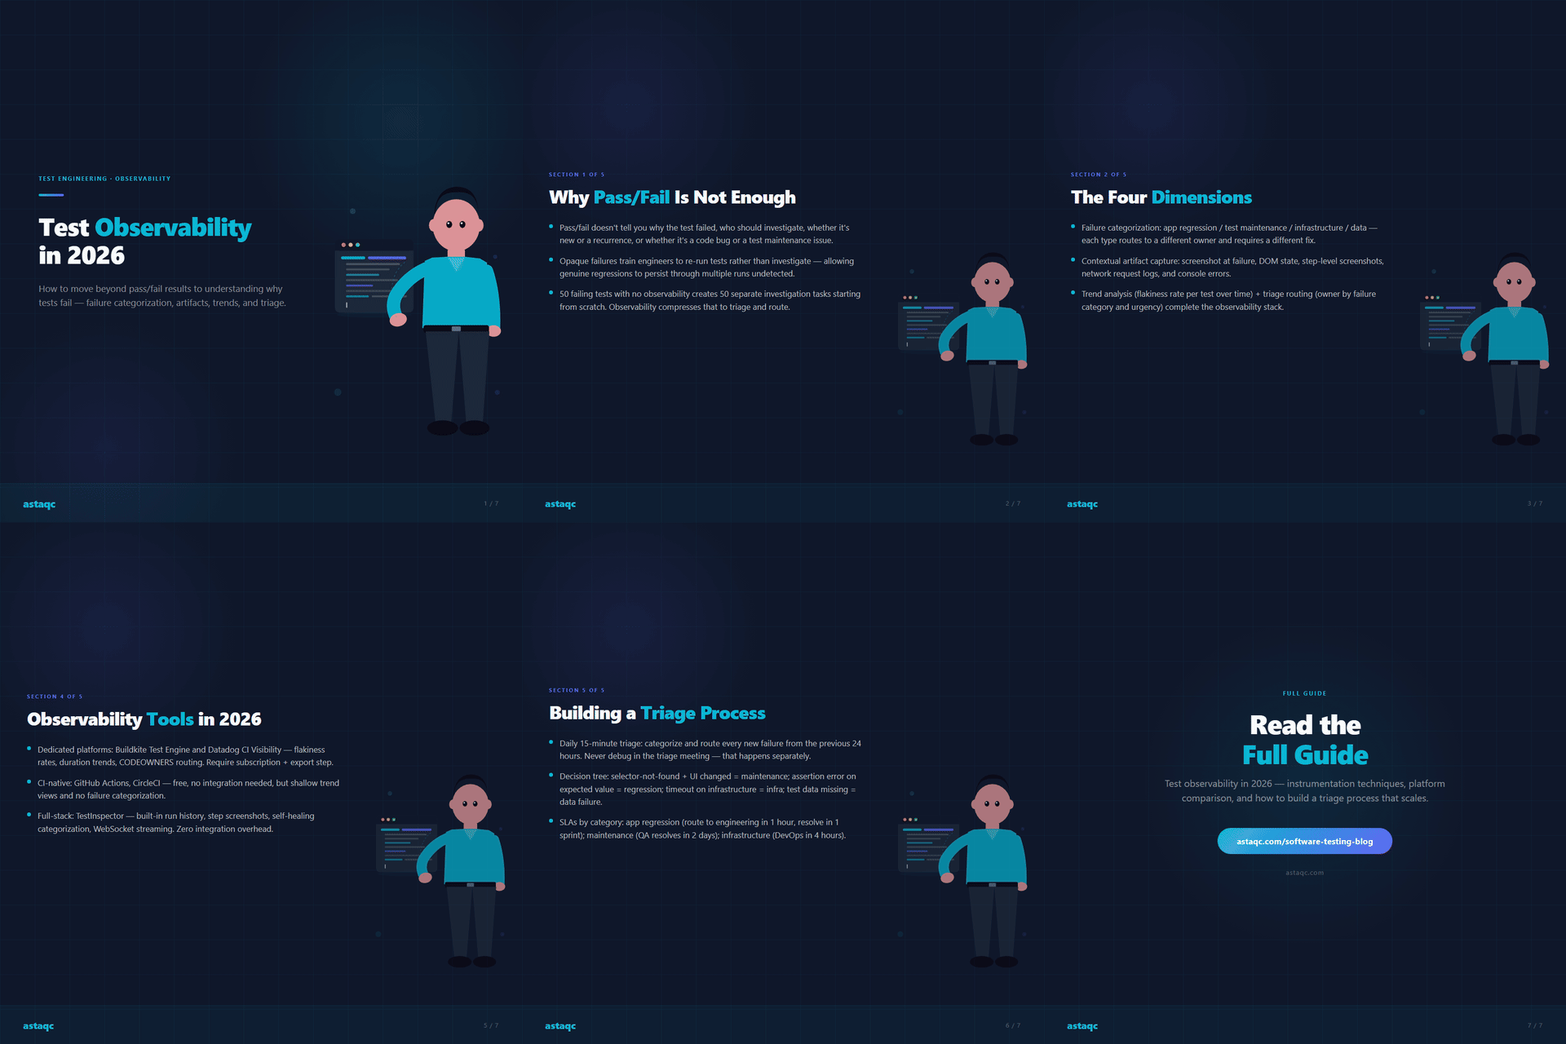
A pass/fail result tells you which test failed, at what time, and optionally which assertion failed inside it. For a suite of ten tests that rarely fail, this is sufficient: there are few failures, each is likely distinctive, and investigation is quick. For a suite of two hundred tests that fails fifteen tests per CI run, pass/fail results generate a triage queue where the same categories of failures—selector drift, unstable environment, data expiry, genuine regression—appear repeatedly without any mechanism to distinguish them or route them to the right person efficiently.
The specific information gaps that pass/fail reporting leaves open are: whether a failing test has failed before and at what rate, which step inside the test is failing consistently as opposed to randomly, whether multiple failing tests are failing for the same underlying reason such as a shared test data problem or a deployment environment issue, and whether the failure rate of the suite is increasing or stable over time. These gaps mean engineers spend investigation time re-discovering information that a structured observability layer would provide immediately. The time spent re-discovering the same failure patterns across multiple CI runs—because no structured record of previous failure classification exists—is the primary waste that test observability addresses. Astaqc's manual vs. automated testing guide covers how test observability fits into the broader testing strategy for teams scaling from manual to automated coverage.
Test observability has four distinct dimensions: failure categorization, contextual artifact capture, trend analysis, and triage routing. Each dimension answers a different question about test failures, and each requires different instrumentation. A mature test observability system addresses all four; most teams start with artifact capture (because it is the most immediately useful) and build toward trend analysis and triage routing over time.
Failure categorization answers: what type of failure is this? The most useful categorization scheme distinguishes between application regressions (the application code changed and broke expected behavior), test maintenance failures (the test code needs updating because the application UI changed without the behavior changing), infrastructure failures (the test runner, browser, or environment had a transient issue unrelated to either the application or the test), and data failures (the test data or state required by the test was not in the expected state). Categorizing failures by type allows QA leads to see at a glance whether a failing suite indicates a code quality problem, a test maintenance backlog, or an infrastructure reliability issue. Each type routes to a different owner and requires a different resolution action.
Contextual artifact capture answers: what was the application state when the test failed? The minimum artifact set for a useful failure report is a screenshot at the moment of failure, the DOM state (or a page source dump) at failure, and the sequence of steps that executed before the failure. For multi-step tests, step-level screenshots—not just a final failure screenshot—show the progression of state that led to the failure, which is often as diagnostic as the failure itself. Network request logs captured during the test run add the API-layer context needed to distinguish between a rendering failure and an API failure. Console error logs capture JavaScript exceptions that may not surface in the visible UI but contributed to the test failure. Astaqc's TestInspector platform captures step-level screenshots, streaming run output, and DOM state by default, without requiring custom instrumentation for each test.
Trend analysis answers: is this failure getting worse, better, or stable? A single test failure in isolation is an incident; a test that fails intermittently across 30% of runs over the past two weeks is a reliability problem that has been tolerated for two weeks. Trend views show pass rate by test, by suite, and by failure category over time. The most actionable trend metric for most teams is the flakiness rate per test: the percentage of runs in which a test that eventually passed also failed at least once. A test with a 30% flakiness rate is consuming 30% more investigation effort than a stable test and is training engineers to ignore its failures. Identifying and fixing flaky tests by trend analysis—rather than waiting for them to become a loud problem—is one of the highest-leverage uses of test observability data.
Triage routing answers: who should investigate this failure? Effective triage routing requires knowing which team owns the code path the failing test exercises, the failure category (application regression routes to the engineering team that owns the feature; test maintenance failure routes to QA; infrastructure failure routes to DevOps or the test infrastructure owner), and the urgency (a failure on a critical path test before a deployment is urgent; a failure on a non-critical test in a scheduled run is not). Automated triage routing—where failures are tagged with category and owner at failure time rather than during a manual triage meeting—compresses the time between failure detection and the right engineer seeing it from hours to minutes. Astaqc's AI in software testing guide covers how AI-assisted failure categorization is changing triage workflows in 2026.
Achieving each observability dimension requires specific instrumentation choices. The table below maps each dimension to the instrumentation approaches that deliver it, the framework-level support available, and the platforms that provide it natively versus requiring custom implementation.
| Dimension | Instrumentation approach | Provided natively | Requires custom work |
|---|---|---|---|
| Failure categorization | Tag failures at test level (assertion error vs. timeout vs. selector not found vs. network error); map error types to categories in a post-run processor | TestInspector (categorized run output), Buildkite Test Engine (flakiness detection) | Playwright (requires custom reporter or plugin), Selenium (requires custom listener) |
| Contextual artifact capture | Screenshot on failure; DOM dump; step-level screenshots for multi-step tests; network log capture; console error capture | TestInspector (step screenshots + streaming), Playwright (screenshot on failure, video, trace), Cypress (automatic screenshots) | Selenium (requires explicit afterEach hooks); JUnit (no built-in visual capture) |
| Trend analysis | Store run results in a time-series database; build pass rate and flakiness rate views per test and per suite | Buildkite Test Engine, Datadog CI Visibility, GitHub Actions test summary (limited) | Most frameworks: requires exporting JUnit XML to a dashboard or time-series store (Grafana, Datadog, custom) |
| Triage routing | Map test files to code owners (CODEOWNERS); route failure notifications by category and owner; integrate with issue tracker for automatic ticket creation on regressions | Buildkite (CODEOWNERS integration), GitHub Actions (CODEOWNERS-based reviewers) | Most platforms: requires custom webhook + Slack/PagerDuty routing logic; JIRA integration for ticket creation |
The most common instrumentation gap in teams transitioning from basic pass/fail reporting to observability is trend analysis. Screenshot capture is easy to add (most frameworks support it in one or two lines of configuration), and failure categorization can be approximated by parsing error messages. But trend analysis requires somewhere to store the data over time and a view that surfaces patterns. Teams using CI-native test reporting (GitHub Actions summary, CircleCI test results) often find that the data exists—test results are stored—but the views needed to identify flakiness trends or regression patterns are not built into those platforms. Exporting JUnit XML to Datadog CI Visibility or building a lightweight Grafana dashboard over stored test results is usually the shortest path to trend analysis for teams already using those tools. Astaqc's software testing cost guide covers how to evaluate build-vs-buy tradeoffs for test observability tooling.
The test observability tooling landscape in 2026 includes dedicated observability platforms, CI-native test reporting tools, and full-stack testing platforms with built-in observability. The choice between them depends on which frameworks the team uses, where test results are currently stored, and how much custom integration work the team can absorb.
Dedicated observability platforms: Buildkite Test Engine (formerly Test Analytics) is the most mature dedicated test observability platform. It ingests test results via JUnit XML or native SDKs for Playwright, Cypress, RSpec, and others; produces flakiness rates, duration trends, and failure frequency views per test; and integrates with CODEOWNERS for routing. Datadog CI Visibility provides similar capabilities for teams already in the Datadog ecosystem, with the advantage of correlating test failures with deployment events and service health metrics from the same dashboard. Both platforms require a subscription and a results-export step in CI.
CI-native test reporting: GitHub Actions has basic test result summaries; CircleCI and GitLab CI both store test results and provide test failure history views. These are free within the CI platform and require no additional integration, but their observability depth is limited compared to dedicated platforms. They handle artifact capture (test result files) but not failure categorization, and their trend views are shallow. For teams with small suites and limited budget, CI-native reporting is a reasonable starting point.
Full-stack testing platforms: TestInspector provides built-in observability as part of the platform rather than as a separate integration. Run streaming over WebSocket shows execution in real time. Step-level screenshots are captured automatically. Run history is stored per test with pass/fail trend data. Self-healing surfaces selector drift as a categorized failure type rather than an opaque timeout. The advantage of this model is zero integration overhead: observability is delivered by the platform that runs the tests, without requiring JUnit XML export, third-party dashboard setup, or custom webhook routing. The constraint is that this model applies only to tests running in TestInspector; tests in other frameworks require separate observability instrumentation. Astaqc's TestInspector page documents the full observability feature set and how it integrates with CI/CD pipelines via the trigger API.
Observability tooling alone does not eliminate investigation overhead—it requires a triage process that routes failures to the right engineers at the right cadence. Without a defined triage process, even a well-instrumented suite accumulates a failure backlog that demoralizes the team and trains engineers to ignore test output.
An effective triage process for a suite of 100–1000 tests has three components: a daily triage meeting (15 minutes or fewer), a failure categorization protocol, and a resolution SLA by category. The daily triage meeting reviews all new failures from the previous 24 hours, categorizes each one (application regression / test maintenance / infrastructure / data), and assigns an owner with a resolution target. The meeting should not involve debugging—it categorizes and routes. Debugging happens separately, by the assigned owner, after the meeting. Keeping the meeting to categorization and routing prevents it from becoming a debugging session that grows to an hour and loses its daily cadence.
The failure categorization protocol gives the triage team a consistent decision tree: if the failure is a selector-not-found or element-not-visible error and the UI changed, it is test maintenance; if the failure is an assertion error on a value that the application should produce, it is an application regression; if the failure is a timeout or network error that occurred on infrastructure outside the application, it is an infrastructure failure; if the failure is related to test data state (record not found, user not in expected state), it is a data failure. This decision tree can be applied in 30 seconds per failure by any QA engineer who has been trained on it, which keeps the triage meeting efficient even as the suite grows. The resolution SLA by category sets expectations: application regressions should be routed to engineering within one hour and resolved within one sprint; test maintenance failures should be resolved by QA within two business days; infrastructure failures should be escalated to DevOps within four hours; data failures should be resolved by the test data owner within one business day. Astaqc's QA team hiring guide covers how to structure QA team responsibilities for triage and failure ownership at different team sizes.
For a team with fewer than five engineers and a suite of under 50 tests, the minimum viable setup is: screenshot on failure (one configuration change in most frameworks), a shared channel where CI posts failure summaries with links to artifacts, and a weekly 15-minute review of the failure list to identify recurring failures. This does not require a dedicated observability platform. As the suite grows past 100 tests and the failure volume makes manual weekly review impractical, adding a dedicated platform (Buildkite Test Engine, Datadog CI Visibility, or TestInspector's built-in history) becomes worthwhile. Astaqc's test automation services include observability setup for teams at this transition point.
The most reliable approach is to run the failing test in isolation multiple times against a stable environment. If it fails consistently against the same input, the failure is an application bug. If it fails intermittently against identical input, it is a flaky test. Common causes of flakiness that are not application bugs: timing dependencies (the test asserts before an async operation completes), environment state leakage (a previous test left state that affects this test), selector ambiguity (the selector matches multiple elements and the wrong one is sometimes selected), and network timing (an external dependency responds slowly on some runs). A test with a flakiness rate above 5% across 20 or more runs should be investigated and fixed rather than tolerated with re-runs. Astaqc's AI in software testing guide covers how self-healing selectors in platforms like TestInspector reduce a major source of test flakiness.
Playwright does not categorize failures natively, but its error types are consistent enough to automate categorization in a custom reporter. A `TimeoutError` where the page took too long to load typically indicates an infrastructure or network issue; a `TimeoutError` where a locator was not found typically indicates a selector maintenance issue; an assertion error (`expect` failure) where the received value differs from the expected value is an application regression candidate. A custom Playwright reporter that maps error types and error messages to categories—and writes those categories to the JUnit XML output—allows downstream tools to consume categorized results. Playwright's built-in HTML reporter stores this information for the most recent run; for trend data, export to a persistent store. Astaqc's complete software testing guide covers how to structure Playwright test organization for maintainability and observability.
Test observability and test coverage answer different questions and should not be conflated. Coverage tells you how much of the application code or behavior is exercised by the test suite. Observability tells you how well the team can understand test failures when they occur. It is possible to have high coverage with poor observability (many tests that fail opaquely) and low coverage with excellent observability (few tests that fail very clearly and informatively). The practical sequence for most teams is to establish a coverage baseline first, then invest in observability so that the coverage the team has is reliable and actionable. Coverage without observability produces a suite that the team cannot trust; observability without coverage produces a suite that fails clearly but misses whole areas of the application. Both are necessary for a mature testing program. Astaqc's manual vs. automated testing guide covers how observability requirements change as teams shift from manual to automated coverage.
Test observability adds the most value when integrated with deployment gates: if a pre-deployment test run produces failures, the deployment pipeline needs to decide whether to block, warn, or proceed based on failure category and severity rather than the raw pass/fail count. An infrastructure failure that is unrelated to the code change being deployed should not block the deployment; an application regression on a critical path test should. This requires the deployment pipeline to consume categorized failure data—not just a pass/fail bit—from the test observability system. Buildkite, GitHub Actions, and GitLab CI all support configurable pipeline conditions that can consume structured test result data. Designing the failure categorization schema with deployment-gate consumption in mind from the start avoids the need to retrofit this later. Astaqc's test automation services include CI/CD integration design for teams building observability-aware deployment pipelines.
Pass/fail reporting tells you what happened; test observability tells you why, who should fix it, and whether it is getting worse. The difference is the difference between a dashboard and a diagnostic system.
September 9, 2026


Sign up to receive and connect to our newsletter

We founded ASTAQC as a tight-knit group of professional Software Testers and software developers.
Subscribe to our Newsletter